Oil & Gas

The oil & gas industry can be split into three categories: upstream, midstream and downstream. Upstream processes include exploration and extraction of oil (identifying and removing oil from the earth).
Midstream operations constitute transportation (pipelines, storage facilities, trucking, shipping etc). Downstream operations include refining (turning crude into derivatives) and processing (turning derivatives into other byproducts like chemicals and plastics).
This report will focus on upstream and downstream operations as midstream operations will be covered in supply chain/logistics. Further, the processing component of downstream operations can be considered a form of manufacturing and will also be covered in another report.
Upstream and downstream operations have unique risks and margin profiles
- Upstream: process: exploration and extraction; margin: variable; connotation: speculative, volatile and long term
- Downstream: process: processing, refining; margin: low; connotation: low return, low growth, capital intensive
Oil exploration “101”
Oil field development is typically catalyzed by local government action. Incentives are designed to generate interest in auction leases for exploration of public land and generate royalties for governments.
Once oil is discovered, huge infrastructure investment occurs alongside a number of contractors and local bidders. It typically takes ~10 years to prepare to drill and then drilling typically occurs for 20 to 40 years. After that, land and infrastructure is divested to smaller independents who handle the more expensive long tail of extraction and the decommissioning process.
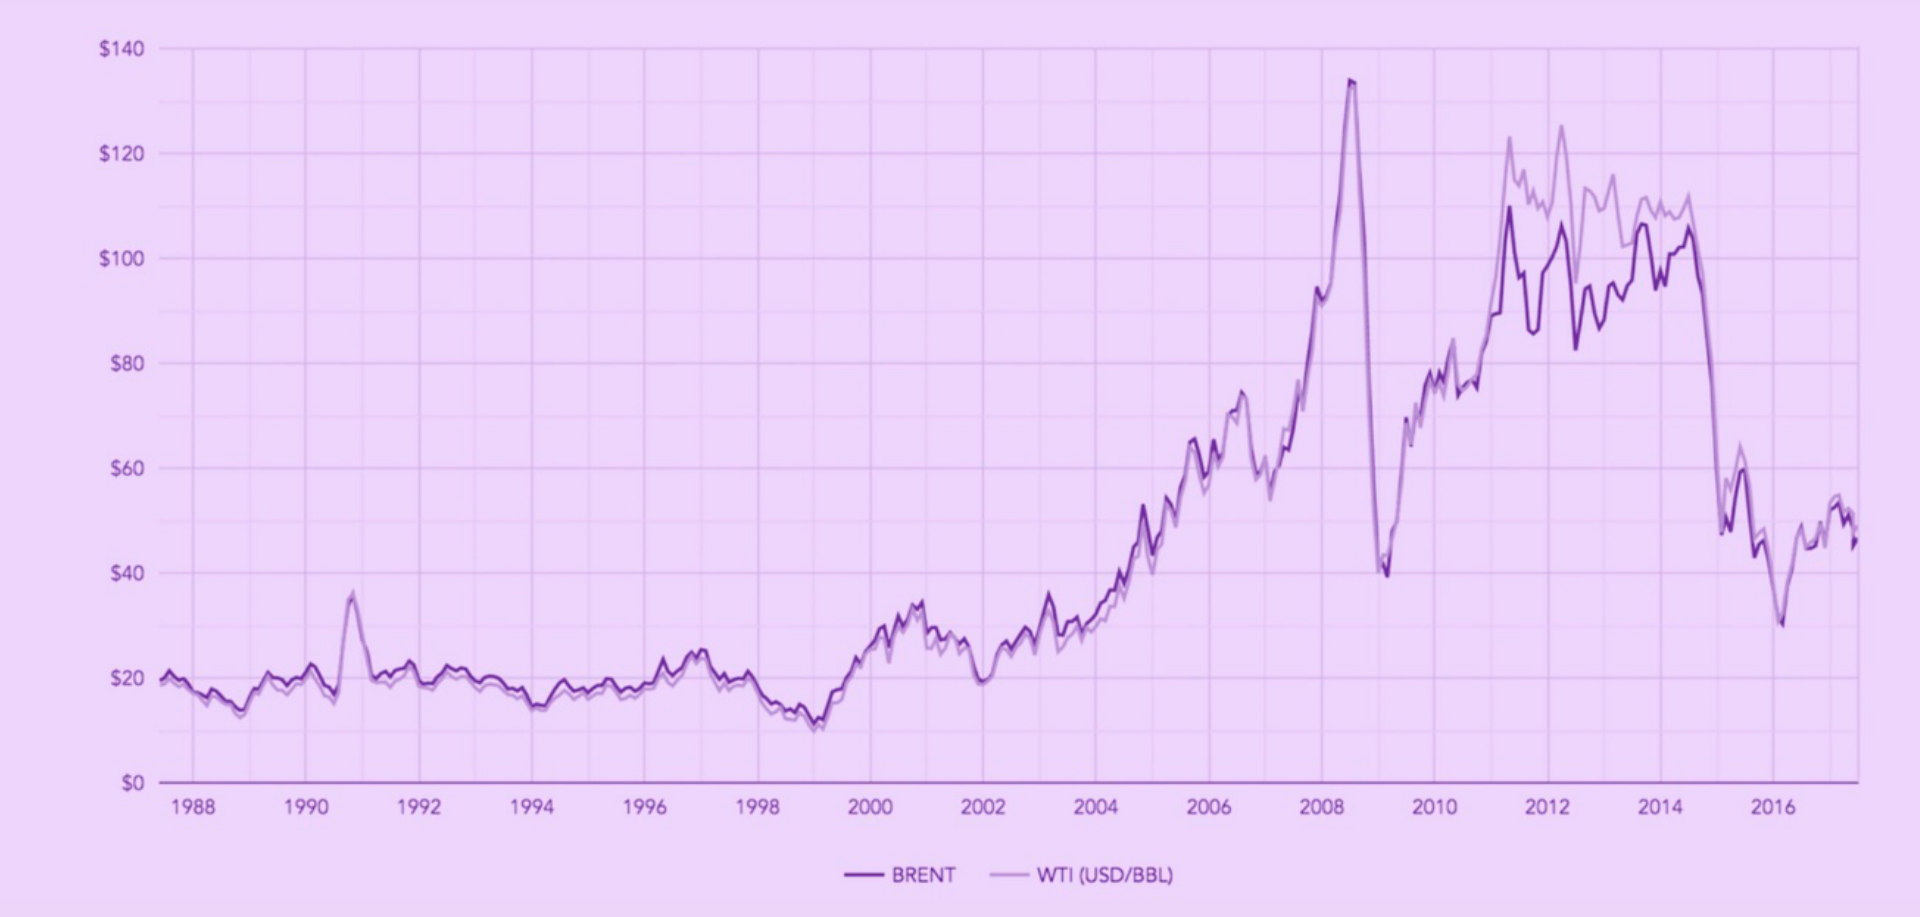
The first thing to understand when it comes to oil is that the price of oil has fallen drastically since its run in the mid 2000s. This fall in prices has eroded margins and slowed investment into new infrastructure and technology.
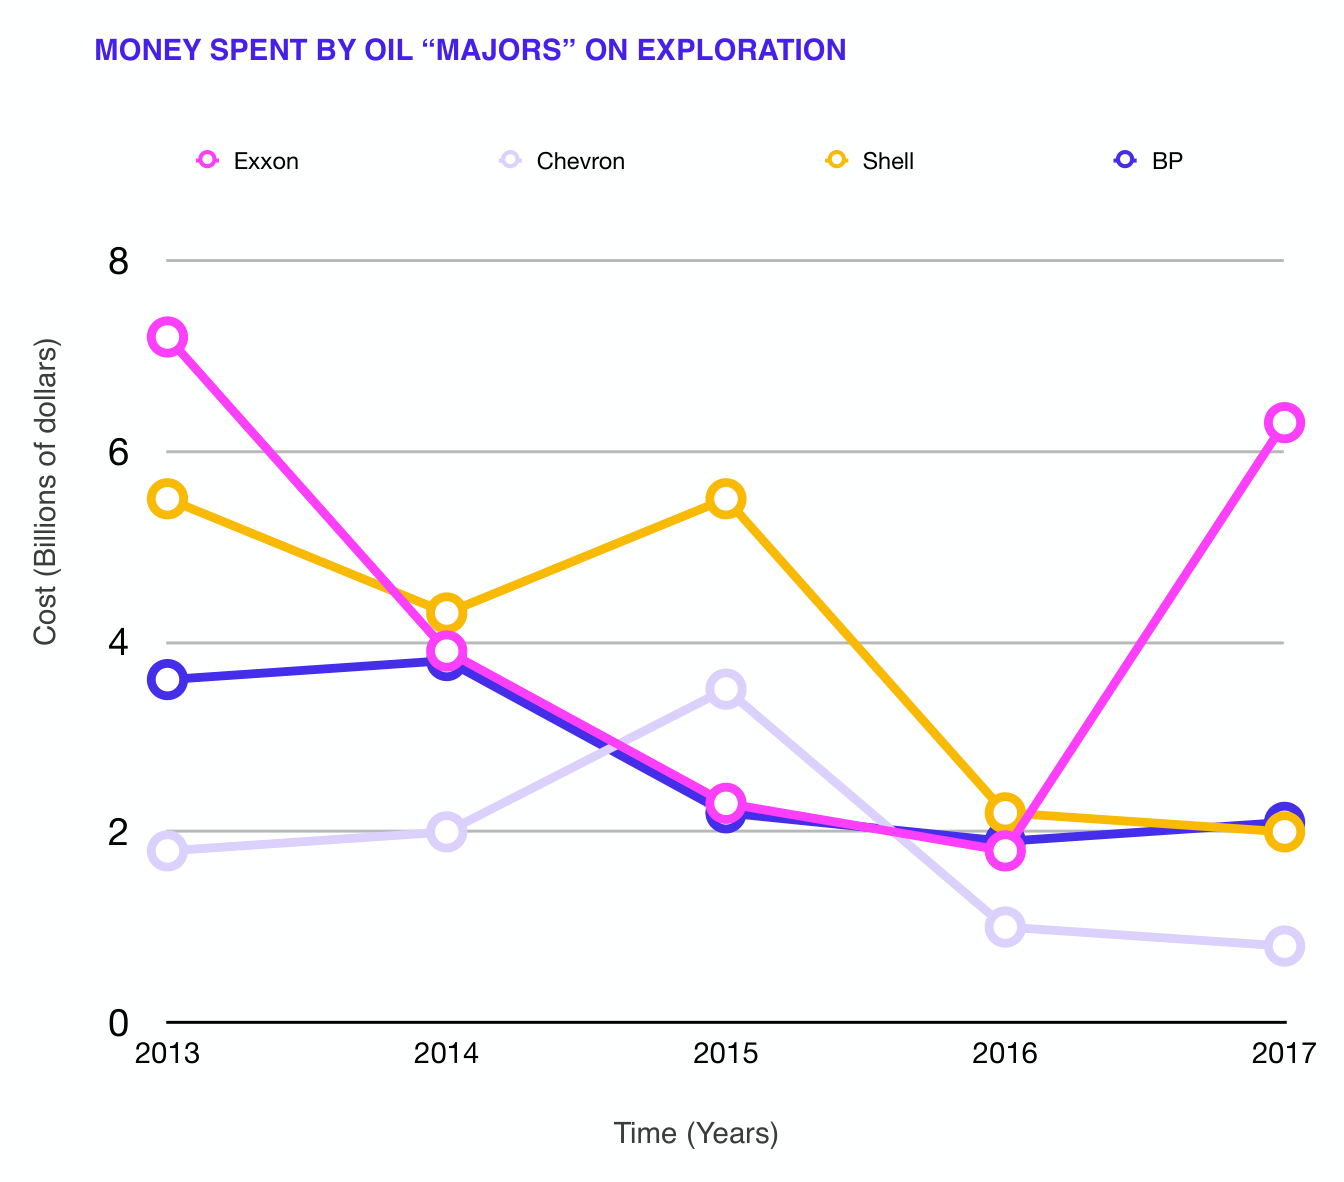
There is one exception to this. Exxon has rebuked the other Majors’ decisions to drastically cut exploration expenses. The company is making a multi-billion dollar bet on discovery at a time when few others are.
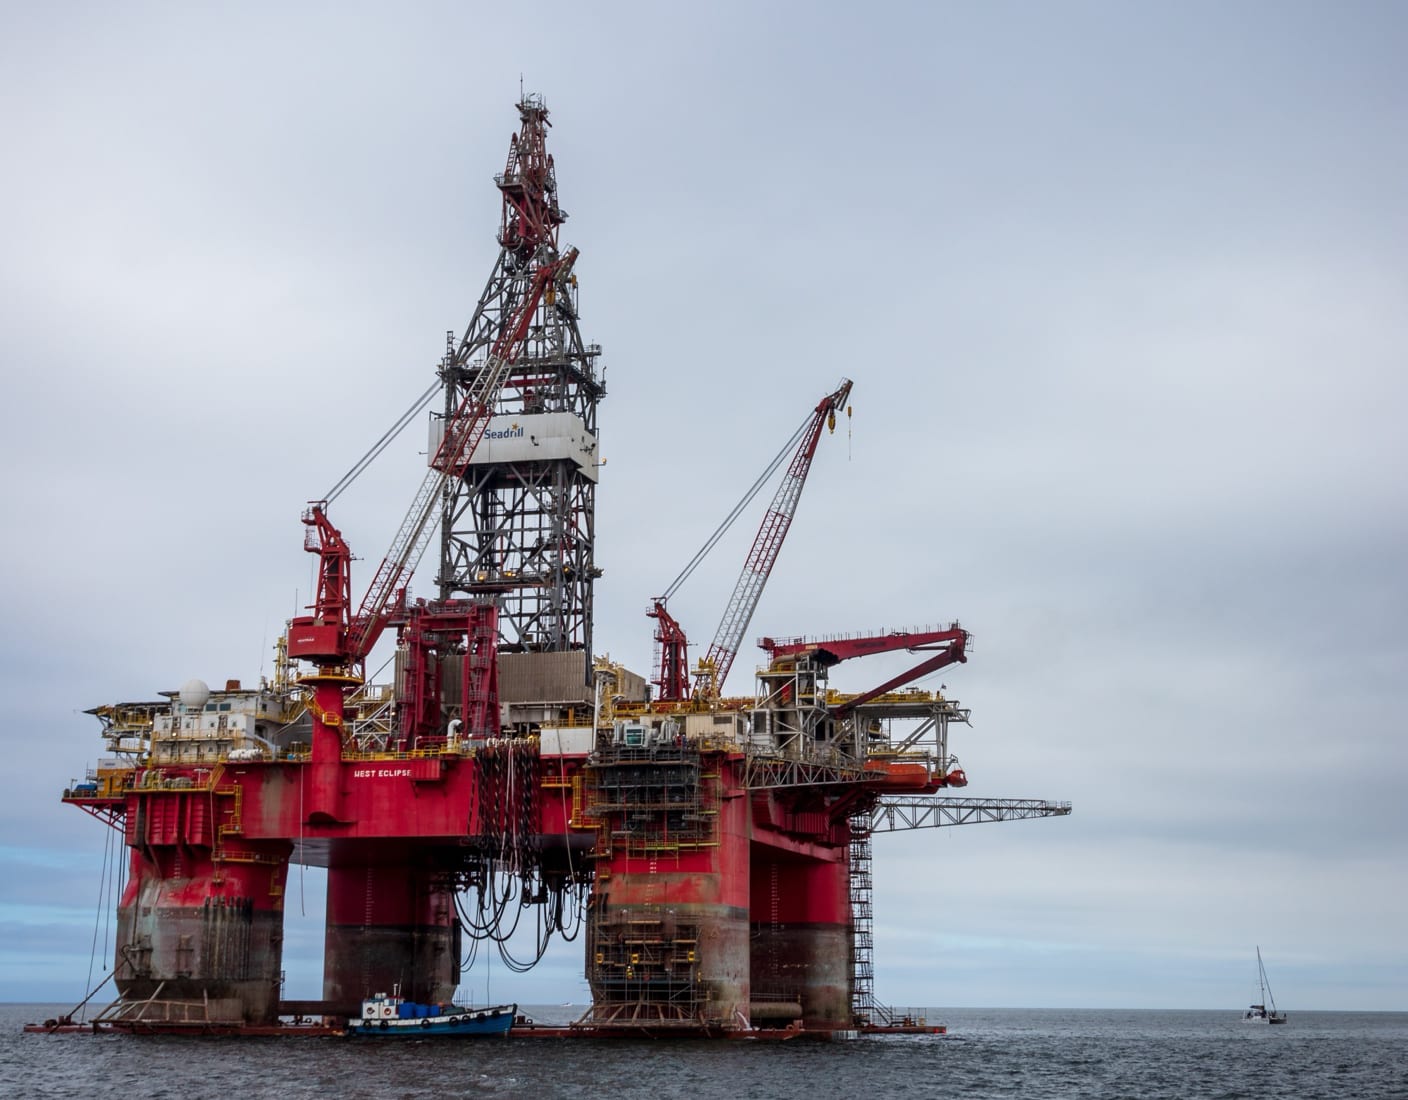
As Majors have moved to cut expenses and divest from non-critical infrastructure to sustain margins, many activities in the exploration and extraction processes have been outsourced to oil field services companies.
These companies are heavily concentrated in the U.S. (65%) and Europe (25%) and capture $350 billion in revenue of $620 billion in total upstream expenditure.
Three of the largest players in oil field services are Halliburton, Schlumberger and National Oilwell Varco
These three companies are representative of the growth in oil field services overall.
Oil field services companies drive technology adoption
Companies like Schlumberger, National Oilwell Varco, and Halliburton have become the technology standard-bearers in the industry — hiring their own software engineers to develop programs for the industry. Schlumberger is heavily marketing its extraction and production software under the sub-brand DELFI.
“The DELFI cognitive E&P environment is a secure, cloud-based space built on key premises that make it unique in our software portfolio. It harnesses data, scientific knowledge, and domain expertise to fundamentally change the way of working in every part of the E&P value chain.
The DELFI environment makes applications and workflows accessible to all users and enables team members to build common workspaces for data, models, and interpretations while respecting proprietary information boundaries.” — Schlumberger
That said, even oil field services companies aren’t immune from the drifting economics of the oil sector. Quite publicly, Schlumberger sold its WesternGeco business unit to Shearwater GeoServices Holding AS for $600 million. That unit handled seismic evaluation of land and sea discovery zones.
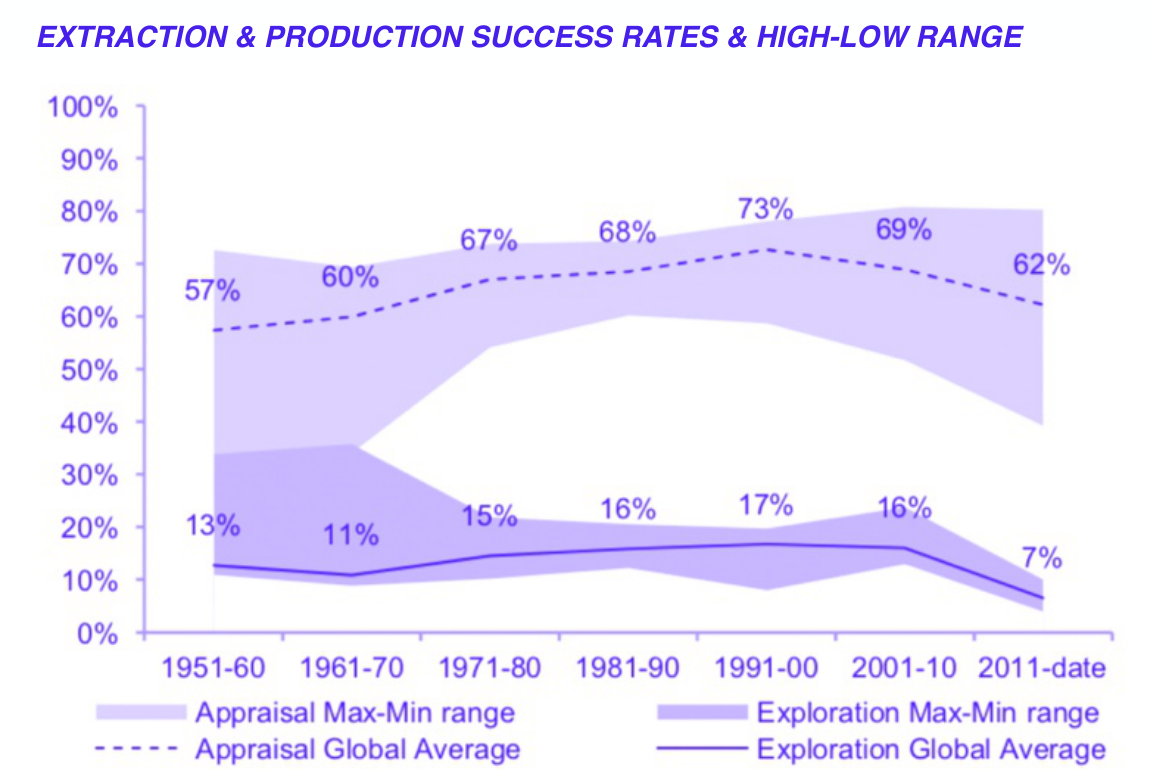
This speaks volumes for the industry’s beliefs on the future of exploration. As an aside, exploration and appraisal rates haven’t budged since the 1950s — though this is somewhat misleading as theoretically the amount of oil to be found has shrunk.
As extraction and production success falls, aging infrastructure is creating two primary opportunities for investment
- Managing aging infrastructure: “An ongoing consideration is that about 85% of the total cost of ownership (TCO) of tools and equipment accumulates from the moment they are deployed until the day they are retired. Therefore, improving the management of assets throughout their life cycle is a primary concern for Schlumberger and its customers.”
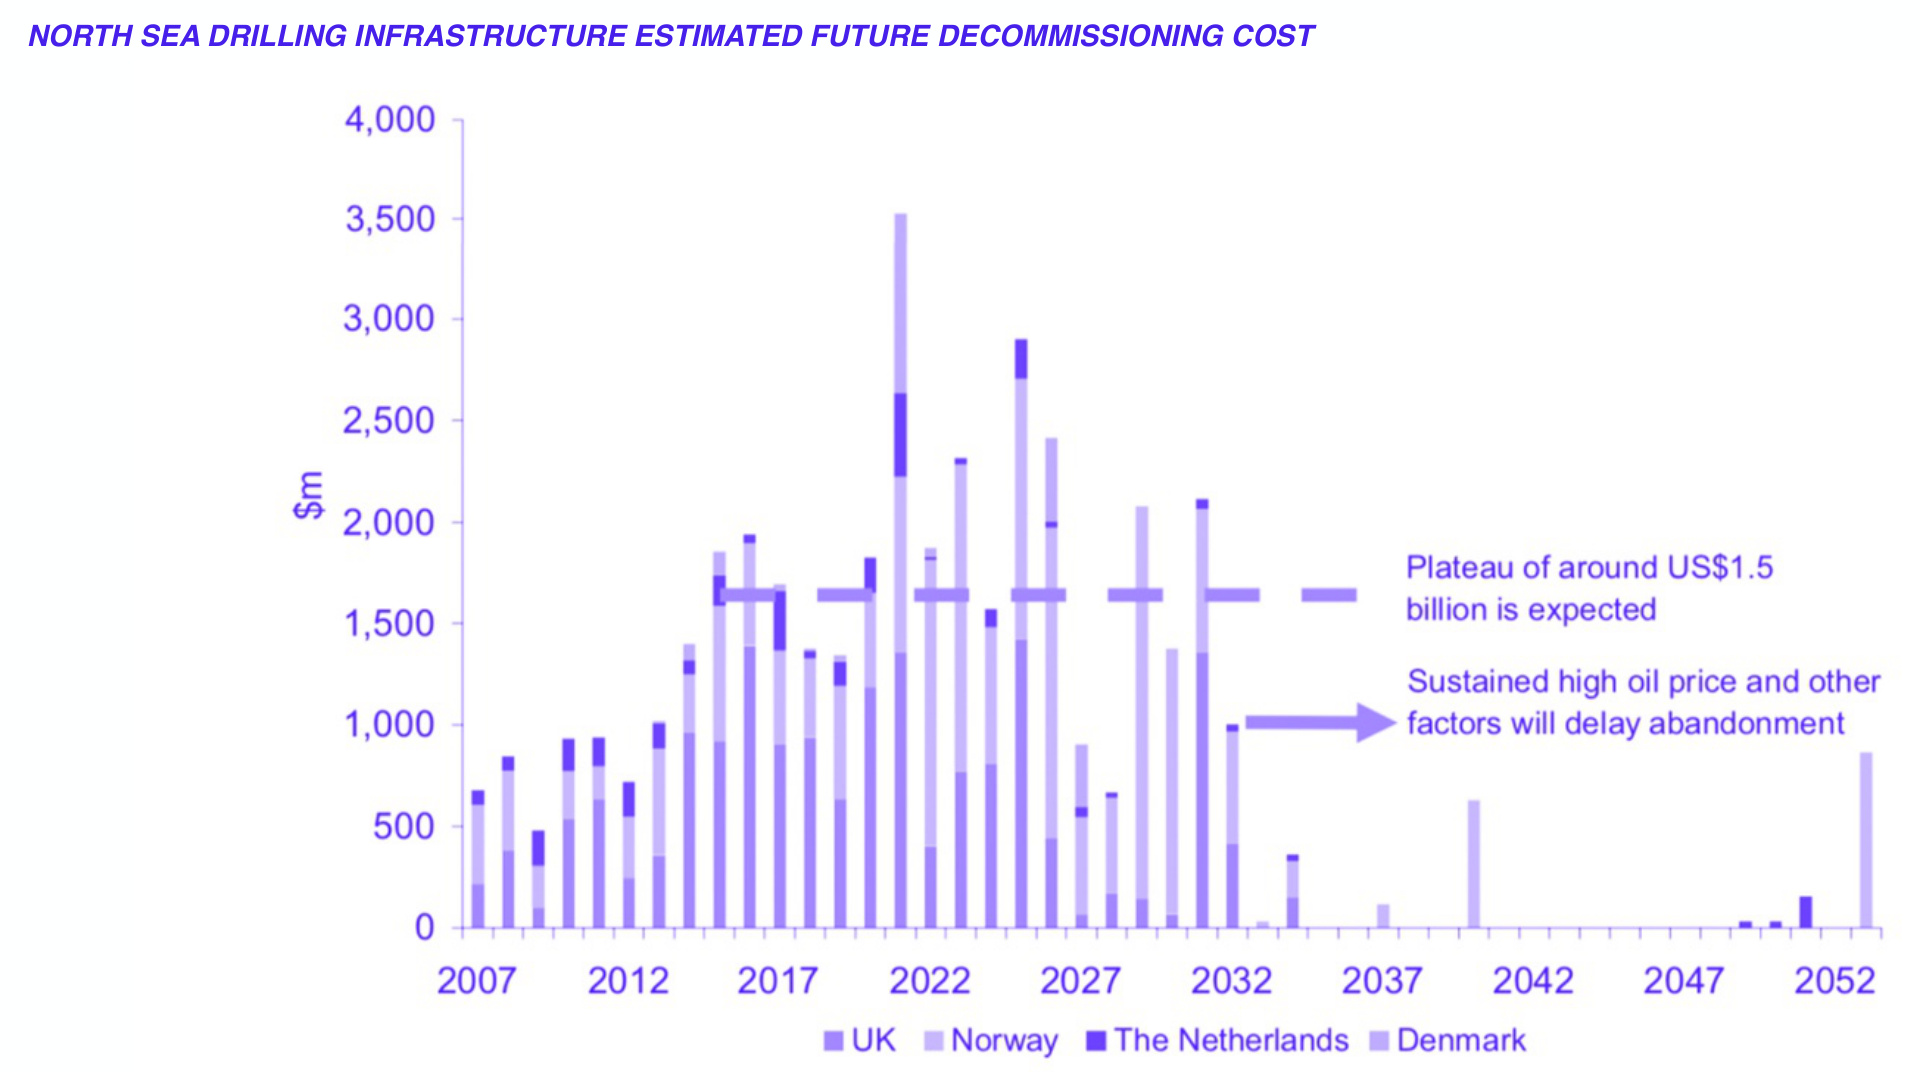
- Decommissioning aging infrastructure: “To give an idea of the scale of costs, the ongoing decommissioning of the North West Hutton field is expected to cost c.$285m, and the decommissioning of Total’s Frigg field is expected to take six years and end up costing c.$700m.”
Decommissioning aging and unproductive drilling infrastructure is necessary, extremely expensive and time consuming
Infrastructure can take years to take fully offline, creating a quasi-recurring revenue stream for companies able to assist oil companies and their services contractors and pulling equipment out of production at as little cost as possible. The North Sea is just one of many aging drilling areas and this cluster alone will generate billions a year in decommissioning expenditure.
An overview of data generated throughout the upstream lifecycle
- Identify targets: seismic data
- Drill exploration well: mud logs & data from wellsite geologist
- Drill appraisal well: coring data, wireline logs, LWD data and well test data
- Develop the field: drilling data, SURF data, pipeline data
- Extend the field life: data from infill drilling, injection wells, gas lifts, pumps and fracturing
While CapEx dominates expenditures, increasing OpEx is creating pressure to reduce costs
Most money today is going into the development of existing discoveries rather than new exploration efforts. And while a good portion of the conversation focuses on CapEx, OpEx is also important. While spending on labor only constitutes 20-25% of OpEx, its share has increased as salaries have been driven up by shortages of skilled labor for various technical positions. Key drivers of OpEx include the cost of bulk materials (primarily steel for piping) and the cost of skilled labor (labor shortages are driving up salaries). Solutions that can help enterprises get these expenses under control to sustain margins are in high demand.

Commonly used upstream & downstream software
Most specialty software for oil and gas originates from oil field services providers. Many of these ERP-style tools have very small TAMs but there is something to be said about consumerization of data analysis and team management tooling, especially for smaller independents. Some predict that as majors continue to divest assets, smaller independents will grow in market share and a robust long tail will open up opportunities for startups — though this has yet to be seen with such low oil prices.
Field operations
- Pen & paper
- Mobile FDC: Mobile field forms with “Turbo Tax” like interface. Vendors: P2 Merrick, Quorum myquorum Field Operations, Field Squared
- SCADA: Supervisory Control and Data Acquisition; hardware installed at wellhead automatically transmits volumetric readings/measurement to “Control Room”. Vendors: eLynx, PetroCloud, Cygnet, ScadaVisor, Bentek Systems, Emerson
Control room
- Wellsite monitoring: Software typically used in conjunction with SCADA systems to monitor, alert and control wellsite production activity. Vendors: Petrocloud, Cameron (Schlumberger), ALS, WellAware, Detchtion, Zedi Solutions, Well Keeper
- Equipment tracking: Software that manages the lifecycle of production equipment. Vendors: Enersight, P2, Field Aware
- Artificial lift optimization: Operational intelligence tools that use data collected by SCADA systems to analyze equipment performance. Vendors: XSPOC, LOWIS, FlowCal, Quorum PGAS, Peloton WellView
Corporate
- Economics, planning, interpretative apps: Estimates the financial opportunity of different plays through reserves decline curves and acreage/geology grading. Vendors: Halliburton Landmark, Schlumberger Petrel, IHS, Drillinginfo, PHDWin
- Reserves reporting: Software designed to estimate and report reserves for large numbers of wells based on potential income and undeveloped potential. Vendors: Landmark, ARIES, Energy Navigator, IHS, Schlumberger
- Rig scheduling: Software designed to schedule drilling activity by evaluating physical asset availability, well/land inventory and capital allocation. Vendors: Palantir
- Mobile WFM: Tool used to optimize communication and task assignment from the Control Room to the Field. Vendors: TOA (Oracle), ClickSoftware
- Portfolio optimization: Planning tool for Corporate Strategy teams to assess financial implications of various asset scenarios. Vendors: 3esi-Enersight, PetroVR
Back office
- Financial and revenue accounting: Software designed to handle both traditional finance and accounting functions, as well as oil and gas specific production and expenditure data. Vendors: Quorum, P2, SAP, Oracle
- AFE: Software used to track, approve, and manage capital expenditures. Vendors: Pandell, Quorum, Resource Energy Solutions, P2, OgSys, PDSWare, Altius, Energy Navigator, Total Stream, AFE Nexus
- Land management: Software that manages the life cycle of land assets and stores related information
Down stream
- Customer service: Software designed to intermediate and organize communications between upstream and midstream/downstream companies for the purposes of data sharing and billing. Vendors: Quorum/Oildex, DP, Red Dog, PDS Energy, Peloton
- Water management: Tool used for efficient transportation/disposal of water, a byproduct of unconventional plays; used to understand “all in” project economics. Vendors: Digital H2O
Oil refining “101”
Oil refining is the process of turning raw crude oil into more refined (processed) products. The refining process starts with one of many benchmark crudes that have different market prices and different advantages and disadvantages when converting them into finished products. The classification of each type of crude dictates what percentages of refined products are created in the refining process which further dictates the amount of additional processing expense that must be invested in order to produce sufficient quantities of a desired output.
Benchmark crudes
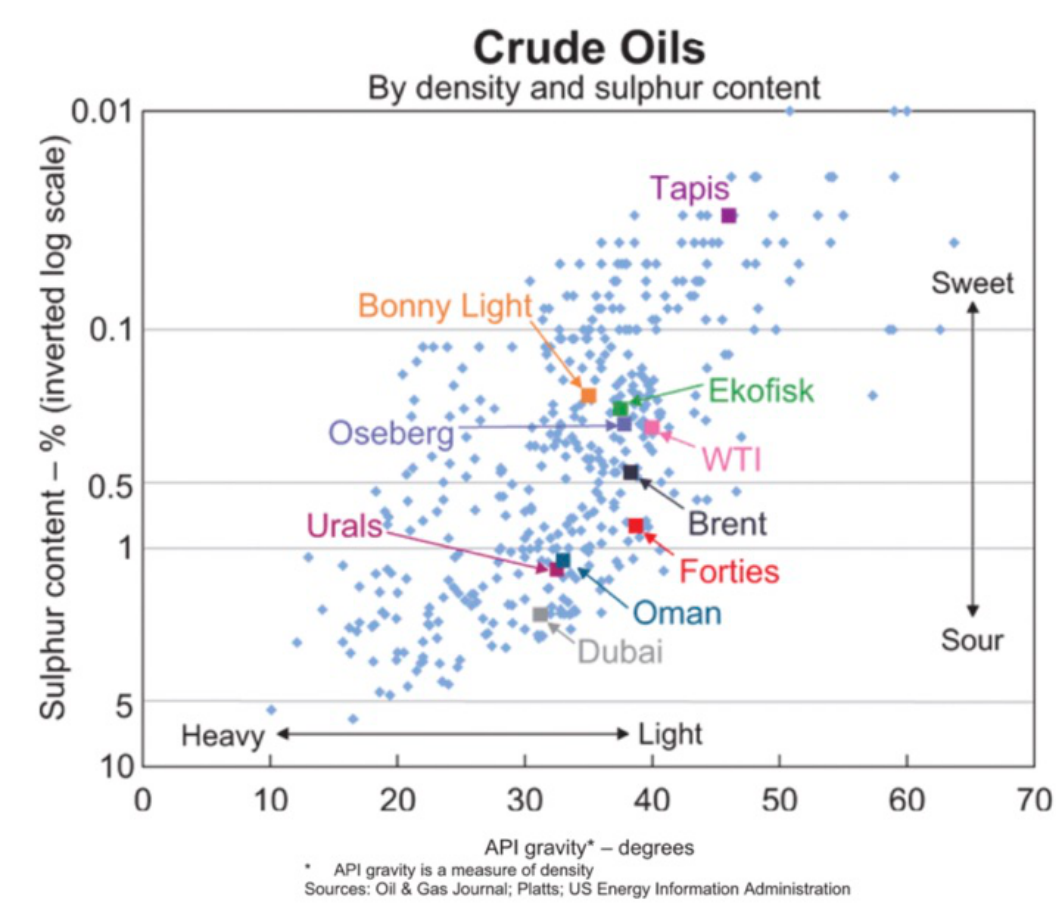
WTI (USA), Brent (Europe), OPEC Reference Basket (MidEast), Bonny Light (Africa), Urals (Russia) etc.
Refining outputs
Each of these different benchmark crude blends contains a different % of key outputs. These outputs include:
- Petroleum $$$
- Naphtha
- Gasoline
- Kerosene
- Diesel
- Lubricating Oil
- Fuel Oil
- Residuals $
Classification
Oil pulled from the earth is typically classified in a two by two (Sweet, sour, heavy and light), where sour vs sweet implies the amount of sulfur that must be removed for purity and heavy vs light indicates the ratio of light vs heavy derivatives obtainable from production. It follows that when sweet light crude is refined, a large amount of petroleum and gasoline is created whereas heavier crude generates more fuel oil and residuals.
Refining type
Refining process are broken down into simple and complex processes. There’s a lot more nuance to these processes but in short, simple processes generate the standard concentration of byproducts for a given caliber of crude where more complex multi-step processes can be used to further refine heavier crude into higher concentrations of more expensive derivatives.
Refining trends
There are four key trends happening in refining.
- Oil is becoming heavier and more sour.
- There is currently a surplus of total refining capacity so the refining process is not efficient and margins are low.
- There is currently a shortage in refining capacity for heavy, sour, crude.
- Majors are divesting from some refining operations: Exxon, Shell, BP, Chevron and Total control 25% of refining capacity — a lot of these players have been reducing refinery exposure which has led to the rise of independent refiners like Valero.
The foundation of arbitrage
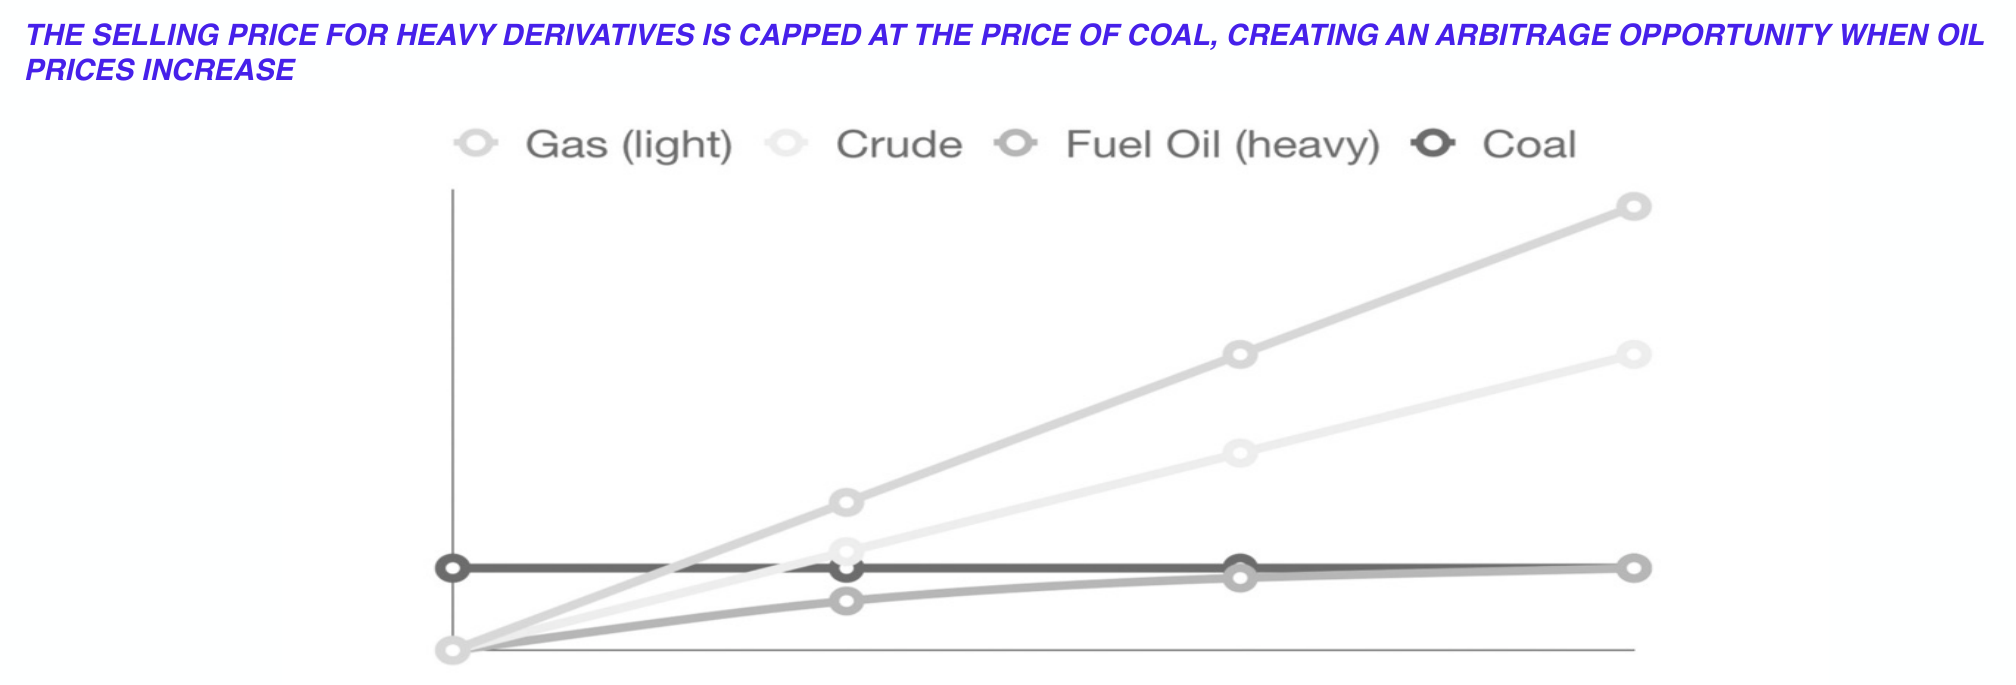
Today coal is commonly used as a substitute for heavier oil derivatives like fuel oil. This means that the selling price for approximately half of oil derivatives is capped at the price of coal. As the price of oil and its derivatives increases, the “crack spread” increases between the capped fuel oil price and the market price for lighter derivatives like gasoline.
This creates an arbitrage opportunity where a limited number of refiners are able to convert fuel oil into gasoline by a second order “complex” refining process at a profit. This further puts pressure on the price of lighter derivatives giving them an even higher market price. This condition is exasperated given that OPEC, which maintains some of the largest oil reserves in the world, stores mostly heavy and sour crude.
Price determinants
Prices are determined by the type of crude being refined, the complexity of the refining process and the location where refining is occurring.
- Type: Crude from the OPEC Reference Basket is more expensive to refine than WTI crude.
- Complexity: If market conditions incentivize heavier derivatives be converted into lighter derivatives, more costly processes must be used.
- Location: Every region has different supply and refining capacity in addition to demand requirements. For example, the U.S. has an excess of diesel that Europe needs and Europe has an excess of gasoline that is sold back to the U.S. Meanwhile Brent supply in Europe differs from WTI supply in the U.S. Transport and infrastructure expense is non-negligible. Location and regional competition affects crude freight costs, product despatch costs, product prices and the relative expense of environmental compliance.
Margin determinants
Margins are determined by the season of consumption, the frequency of downtime, the degree of demand, the amount of residual inventory in the market and specific investment decisions made by producers.
- Season: Lighter derivatives are more in demand during summer driving season while heavier derivatives are more in demand during the winter as they are commonly used for heat.
- Downtime: Refineries frequently suffer from costly downtime. Any interruption in refining can have a meaningful impact on margin.
- Demand: Demand is really only growing in Asia and the Middle East, creating opportunity in these regions. Additional regulation or consumer/regional preferences affect margins if asymmetries develop. i.e. the diesel vs gasoline example in Europe vs the U.S., if infrastructure for refining doesn’t match demand.
- Inventory: The supply of various types of crude is typically used as a forecasting tool for predicting supply shocks within the market.
- Investment: Predicting how much long term investment to make is really hard. The world often over invests in refining. Excess infrastructure can drive down utilization and margins.
Refining is an optimization problem fit for machine learning
Machine learning will help producers know what to produce and when to produce. It will also help producers maximize uptime, optimize supply chains, project appropriate infrastructure investment and identify emerging supply/demand asymmetries to increase profits.
Refining is an extremely low margin business with an overabundance of general capacity. As Asia and the Middle East continue to increase demand for oil derivatives, the industry will need to find new ways to efficiently serve these growing markets. The need for complex refining is increasing as fuel oil is converted into lighter derivatives. Much of this refining responsibility will be offloaded to independents so they too will need access to technology to remain competitive.